Parabolic Sar and Ema 200 Strategy
Create a forex account for free
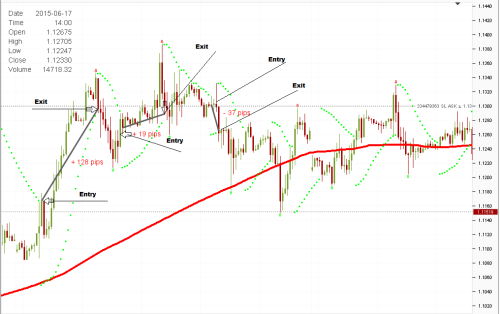
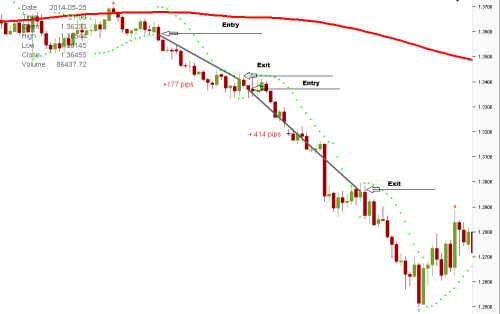
EMA (Exponential Moving Average) are among the most popular Moving Averages. Unlike the Simple Moving Averages (SMA), EMA give greater weight on nearby price values . More and more investors use them in their long-term strategies. Moving Averages periods may vary in different ranges. The most popular are 14, 20, 50, 100 and 200. The purpose of the indicator is to show the current trend. When the price is above EMA we assume that the trend is bullish and vice versa when the price is under EMA, we have a bearish trend. Parabolic SAR indicator is showing our potential points for trend reversals. In recent years, it is used in Forex trading. This indicator is trend-following and many market participants use his points for placing stop loss. Strategy: The strategy in this article uses two indicators: Parabolic SAR and EMA 200. The strategy shows the entrances under certain conditions. With this strategy we don’ have a clear stop loss and target point as they are variable for each transaction Rules for trading: This strategy is suitable for any time frame, from 1 minute to 1 day. With larger time frame, the signals are going to be more The 1 day chart is recommended. Currencies: All currencies are suitable for trading, as the strategy is from a medium to long term Indicators: EMA 200 Parabolic SAR
Create a forex account for freeInput and output: Purchase - We buy when the price is above 200 EMA and above the Parabolic SAR. Stop loss is the last point drawn from the Parabolic SAR. We close our position when the Parabolic SAR is above the price

Sale - sell when the price is below 200 EMA and under the Parabolic SAR. Stop loss is the last point drawn from the Parabolic SAR. Close position is when the Parabolic SAR is below the price

The strategy should not be used 15 minutes before important economic news and 15 minutes after them, because the news creates a high volatility in both directions. Like any strategy and this one can sometimes give us false signals. They can be cleared by using different indicators such as MACD, RSI and others. Also here it is important to be monitored the fundamental analysis because they are more important than any indicator. If the market is set positive, it does not make sense to sell even when the indicators are telling us to sell.


0 Comments